Description
Full Walkthrough
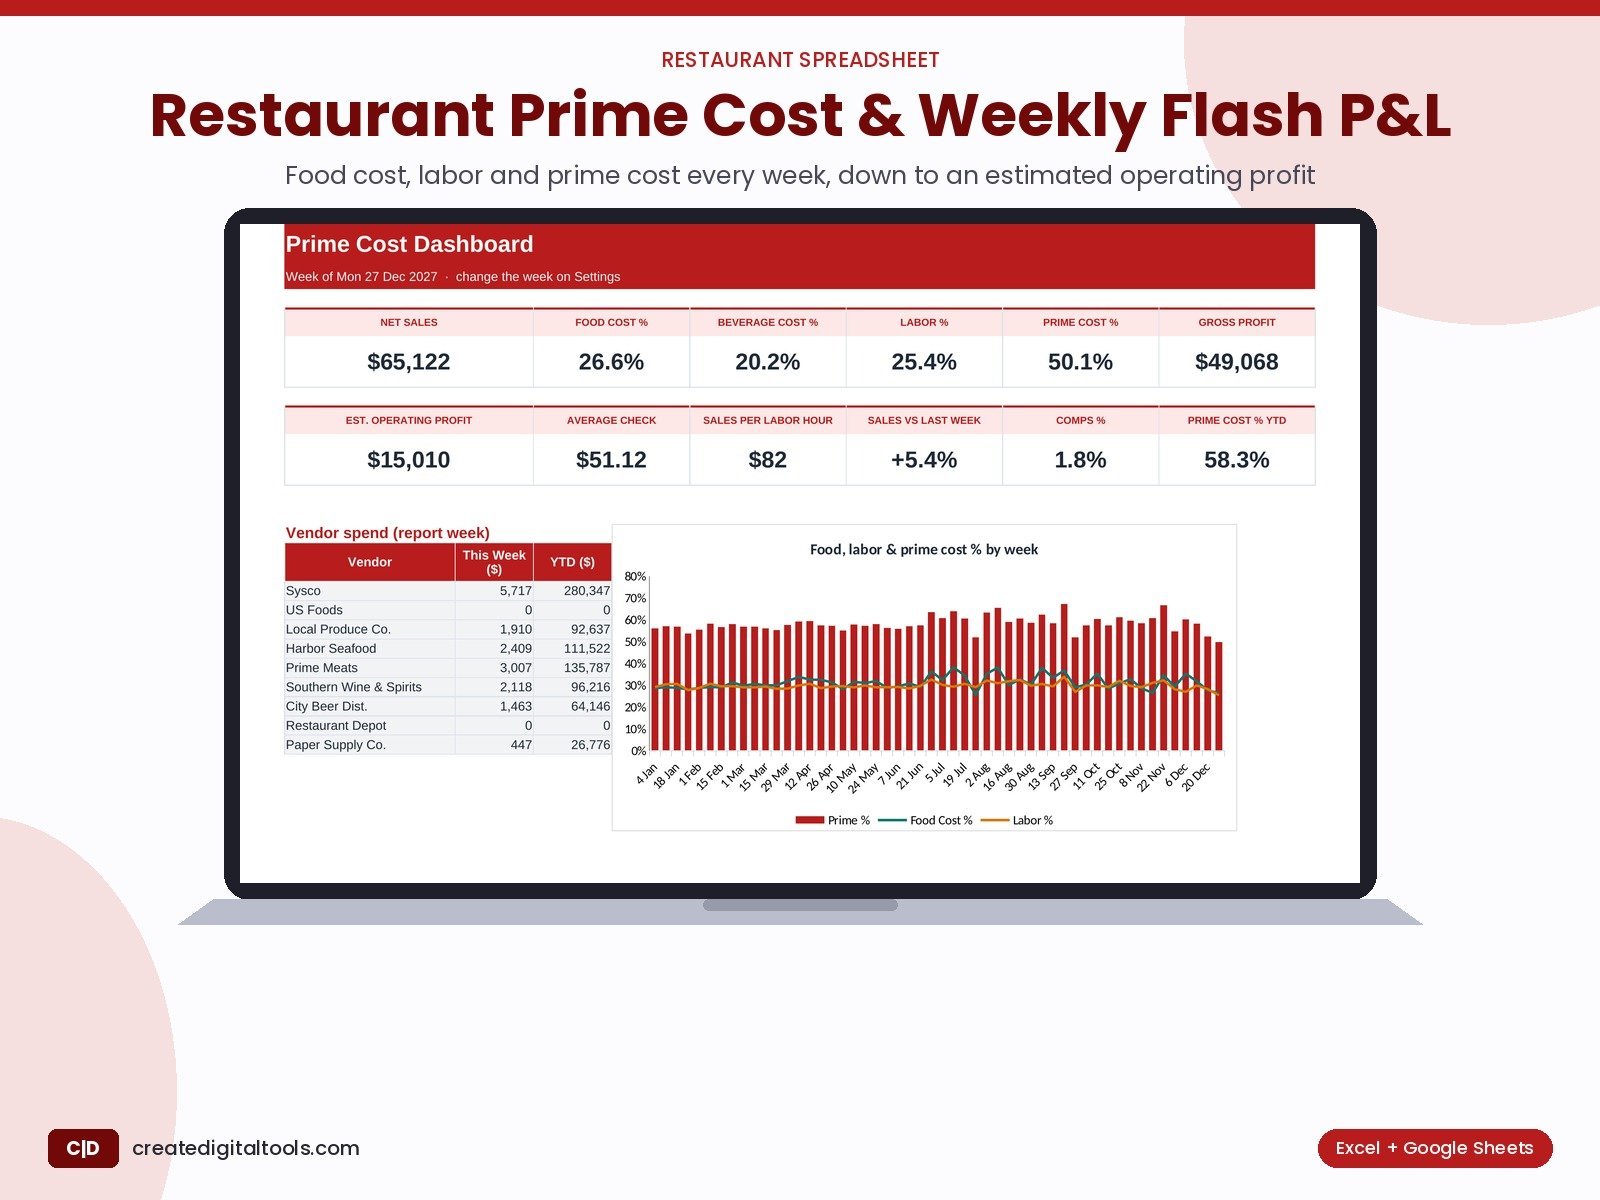
Log daily sales, invoices, payroll and a weekly stock count. See food, beverage, labor and prime cost %, gross profit and estimated operating profit for 52 weeks.
Who it’s for
Independent restaurants, cafes, bars and small groups who want a weekly prime cost number built on real inventory counts, not just purchases.
What’s inside
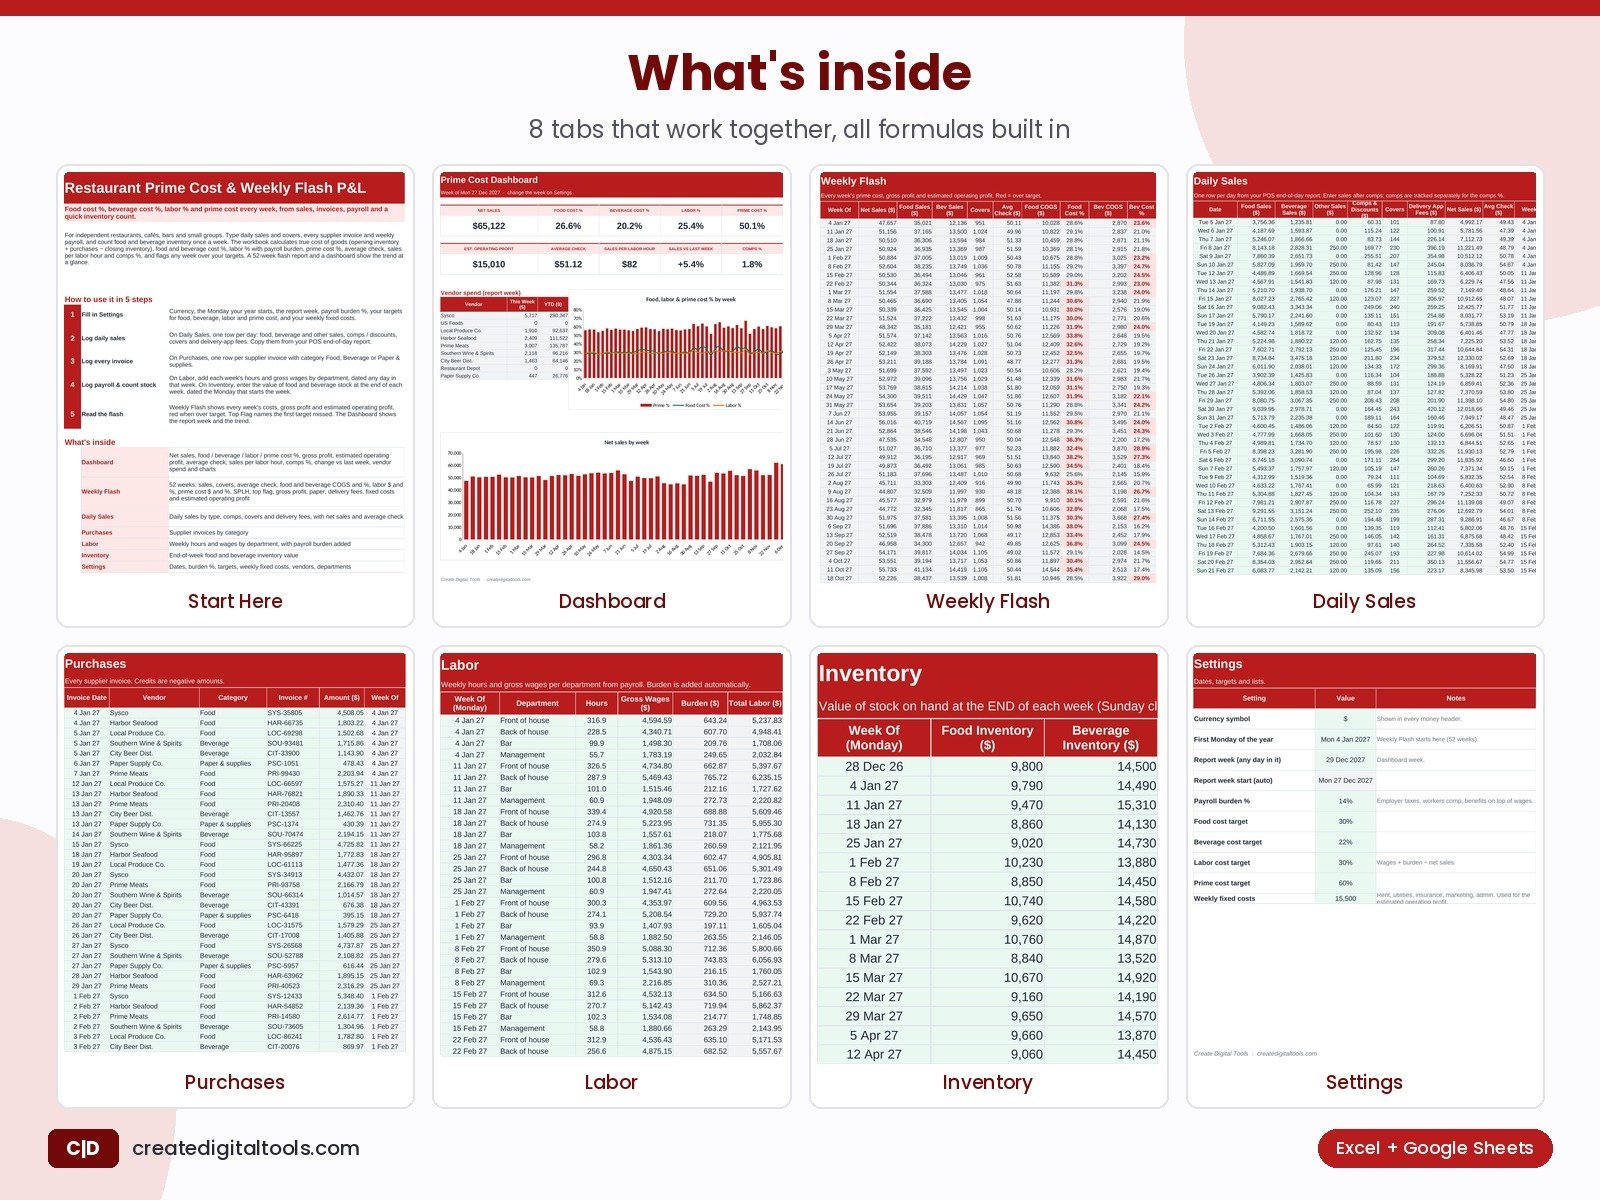
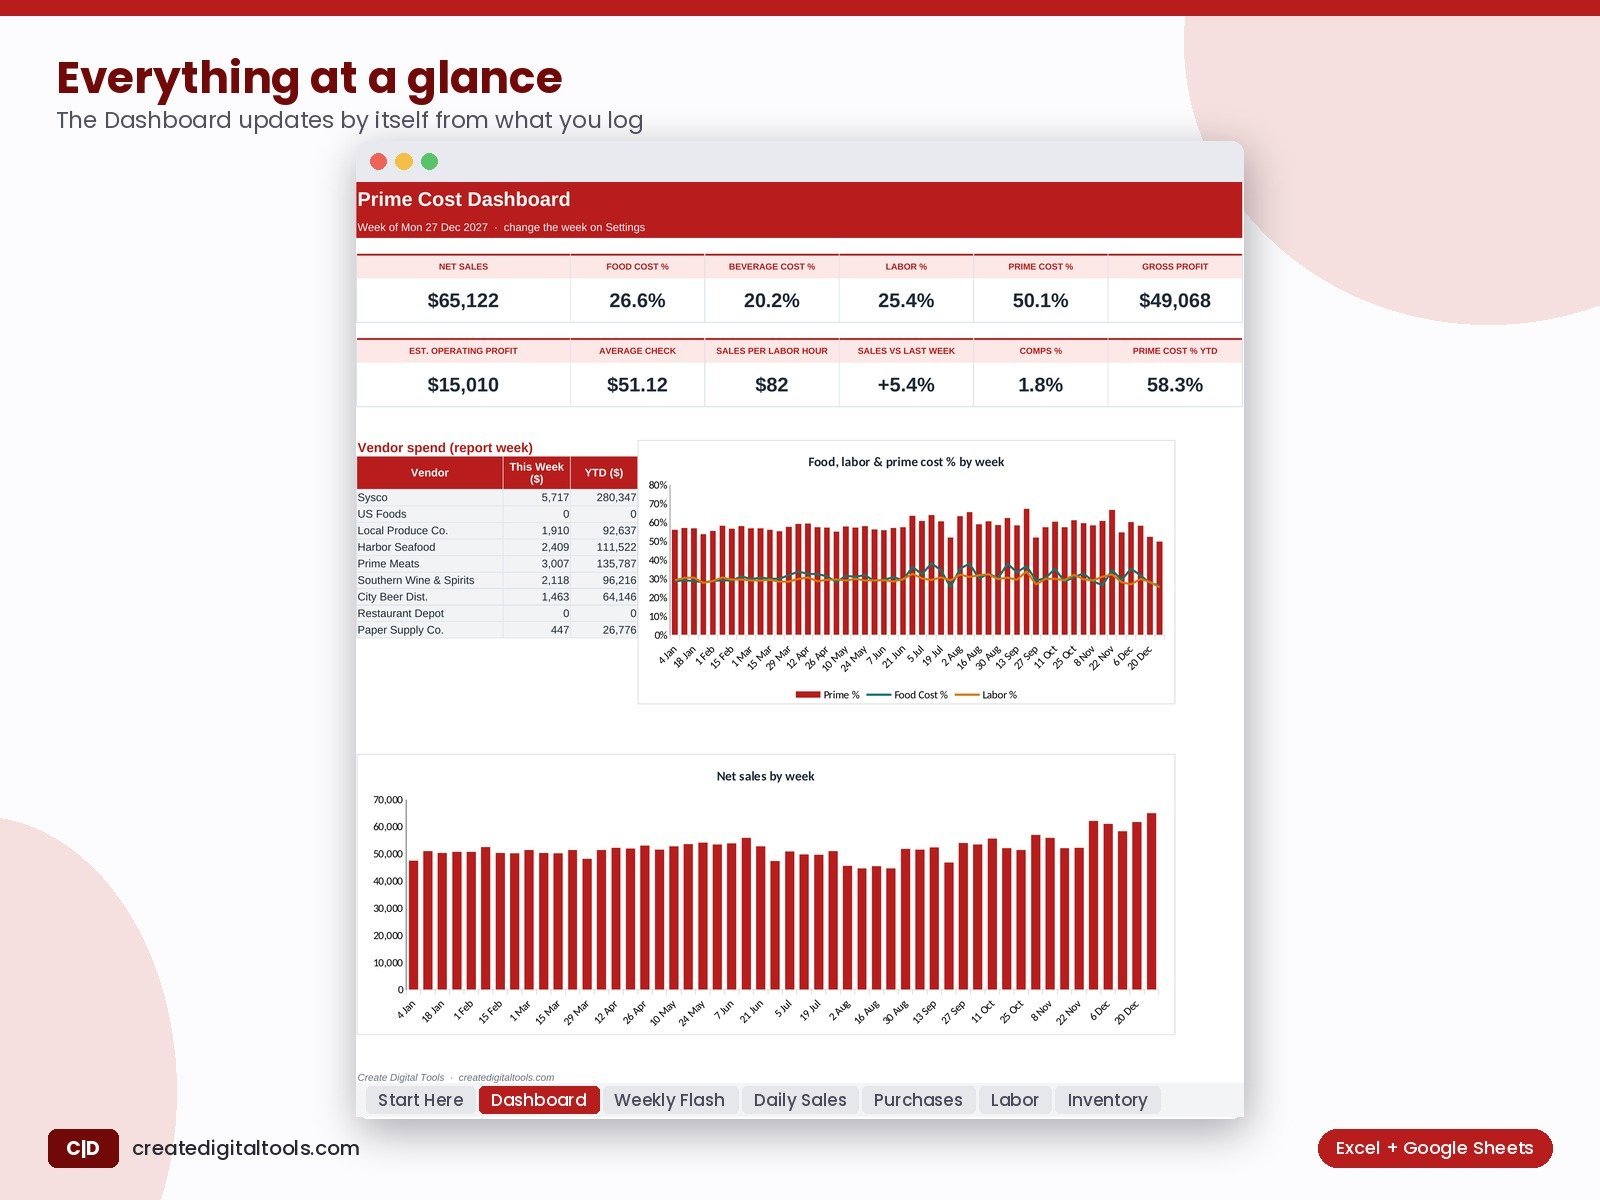
- Dashboard: Net sales, food / beverage / labor / prime cost %, gross profit, estimated operating profit, average check, sales per labor hour, comps %, change vs last week, vendor spend and charts
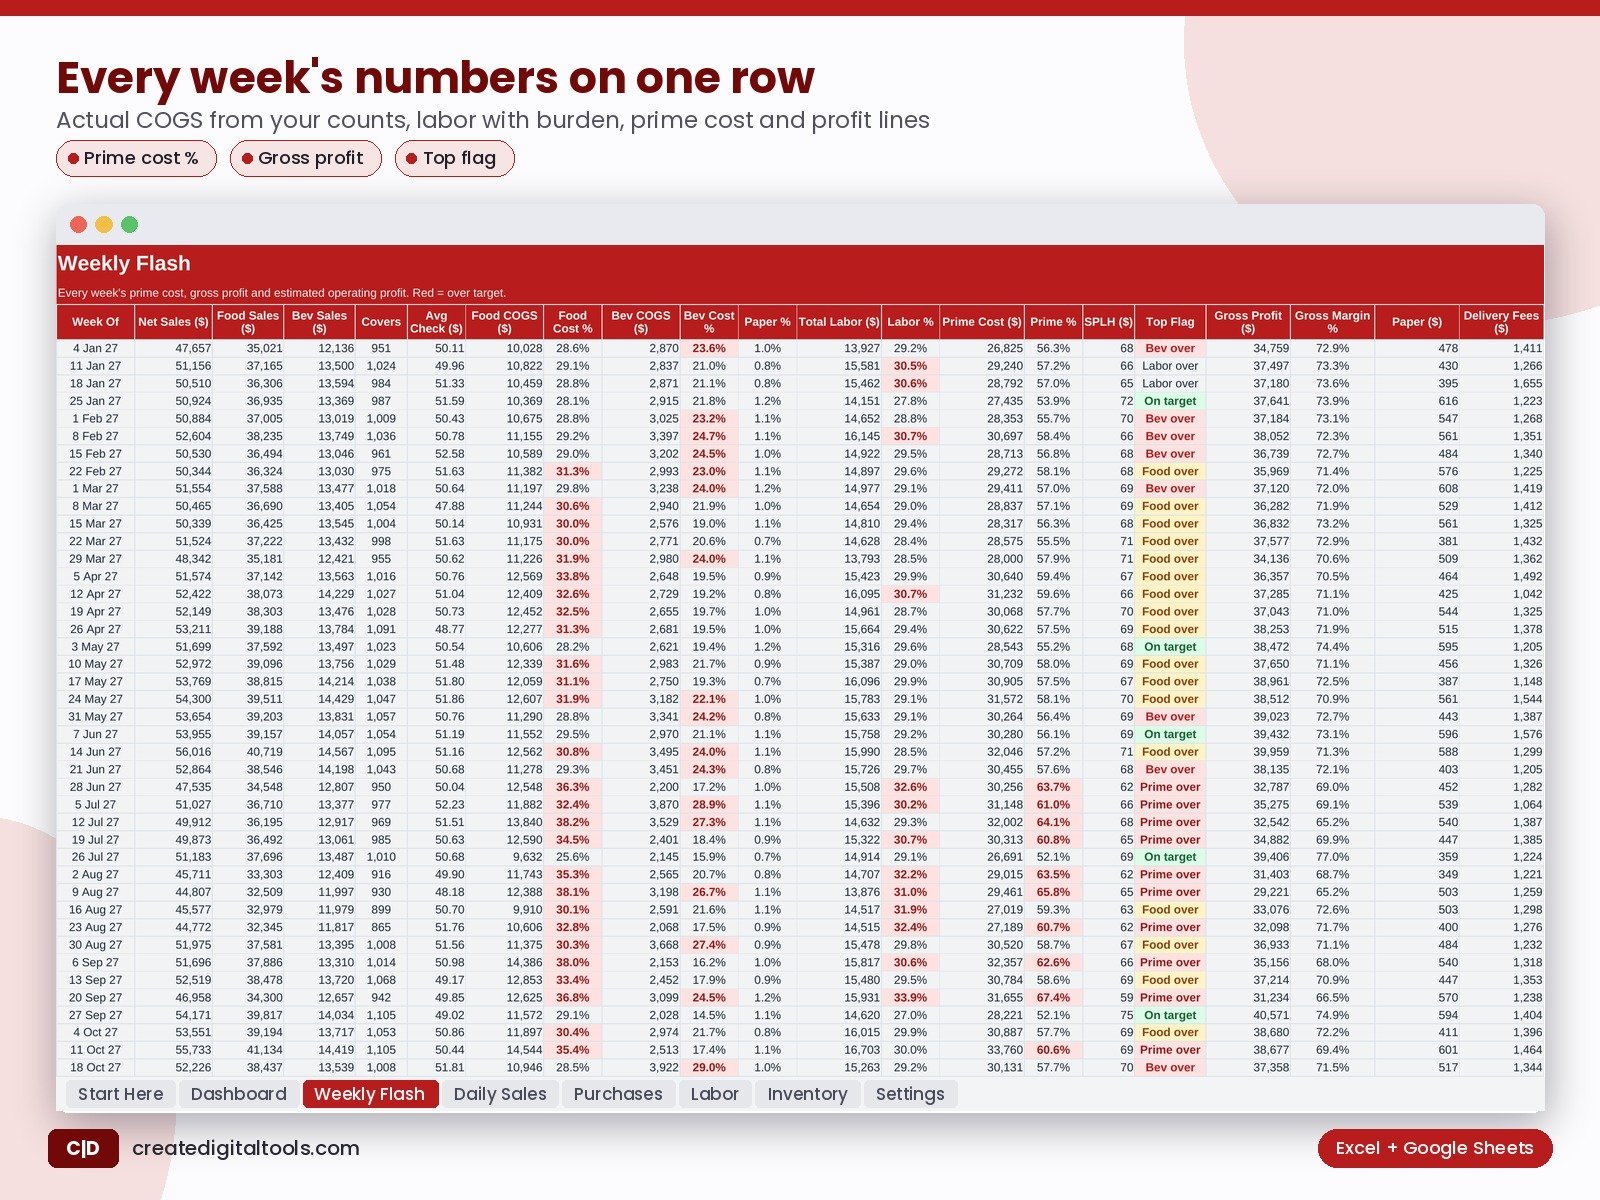
- Weekly Flash: 52 weeks: sales, covers, average check, food and beverage COGS and %, labor $ and %, prime cost $ and %, SPLH, top flag, gross profit, paper, delivery fees, fixed costs and estimated operating profit
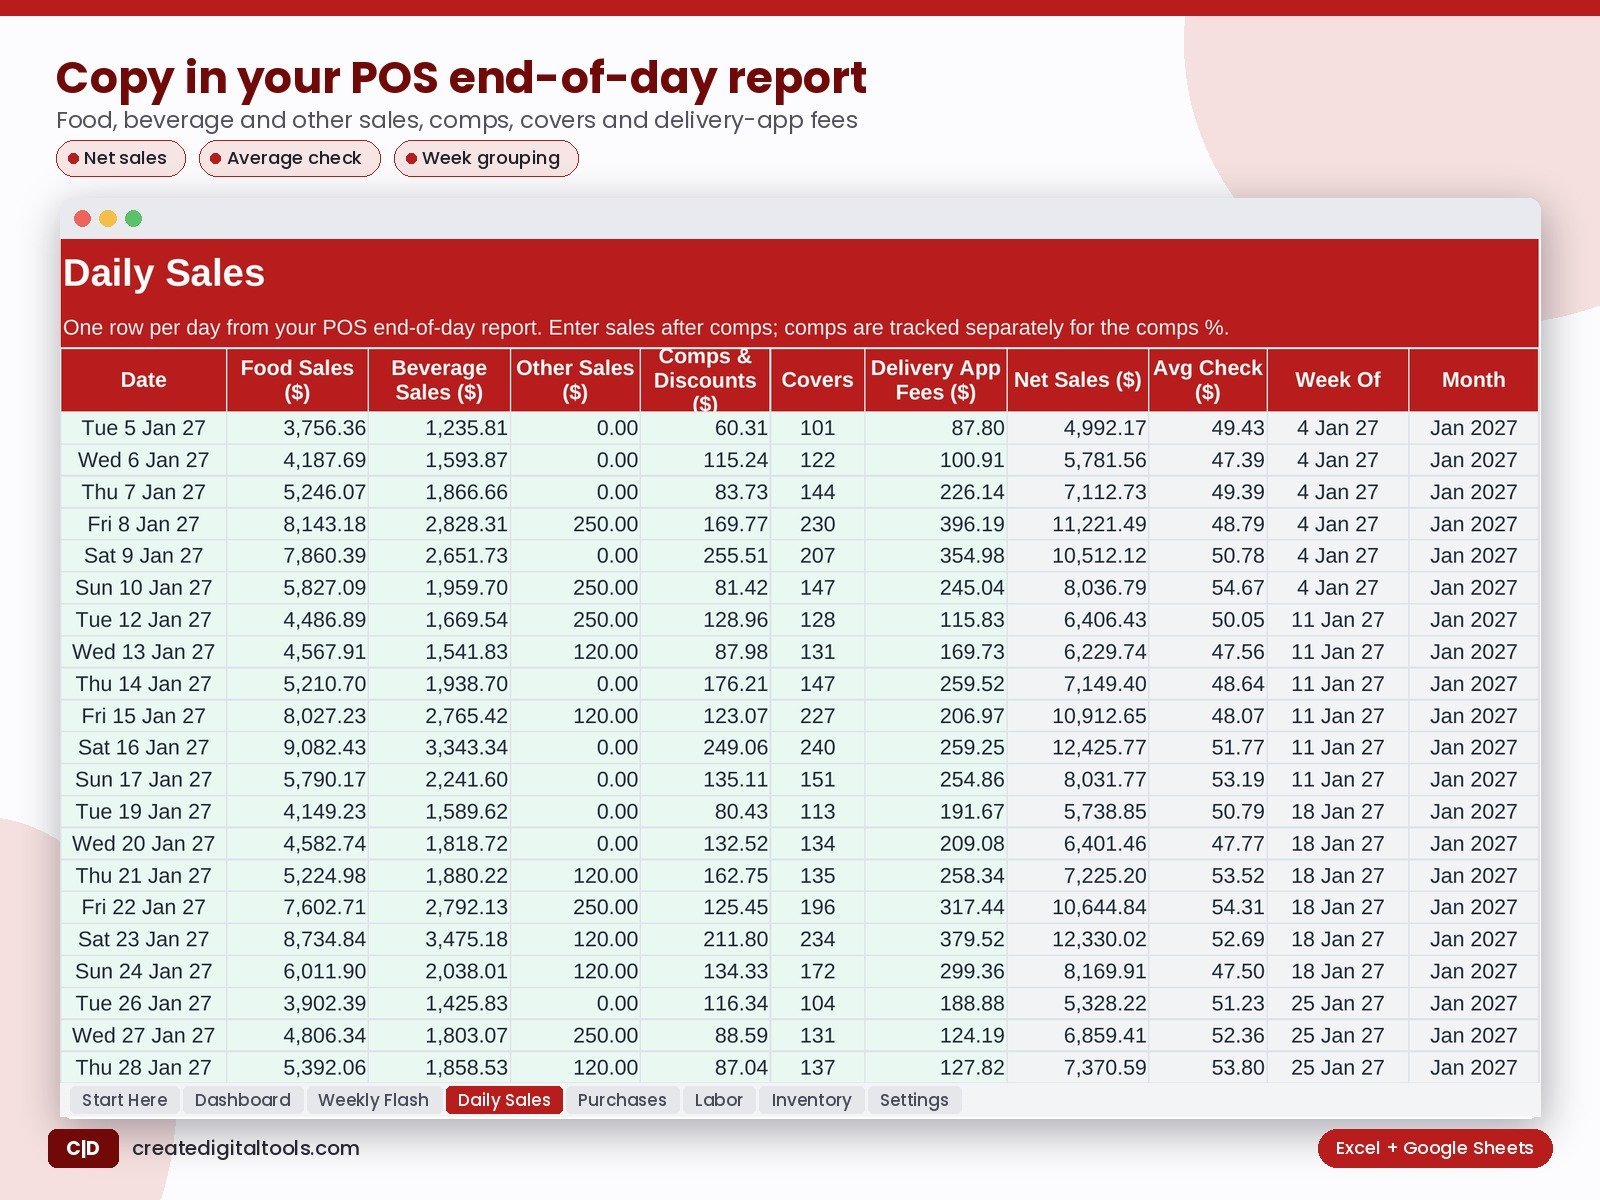
- Daily Sales: Daily sales by type, comps, covers and delivery fees, with net sales and average check
- Purchases: Supplier invoices by category
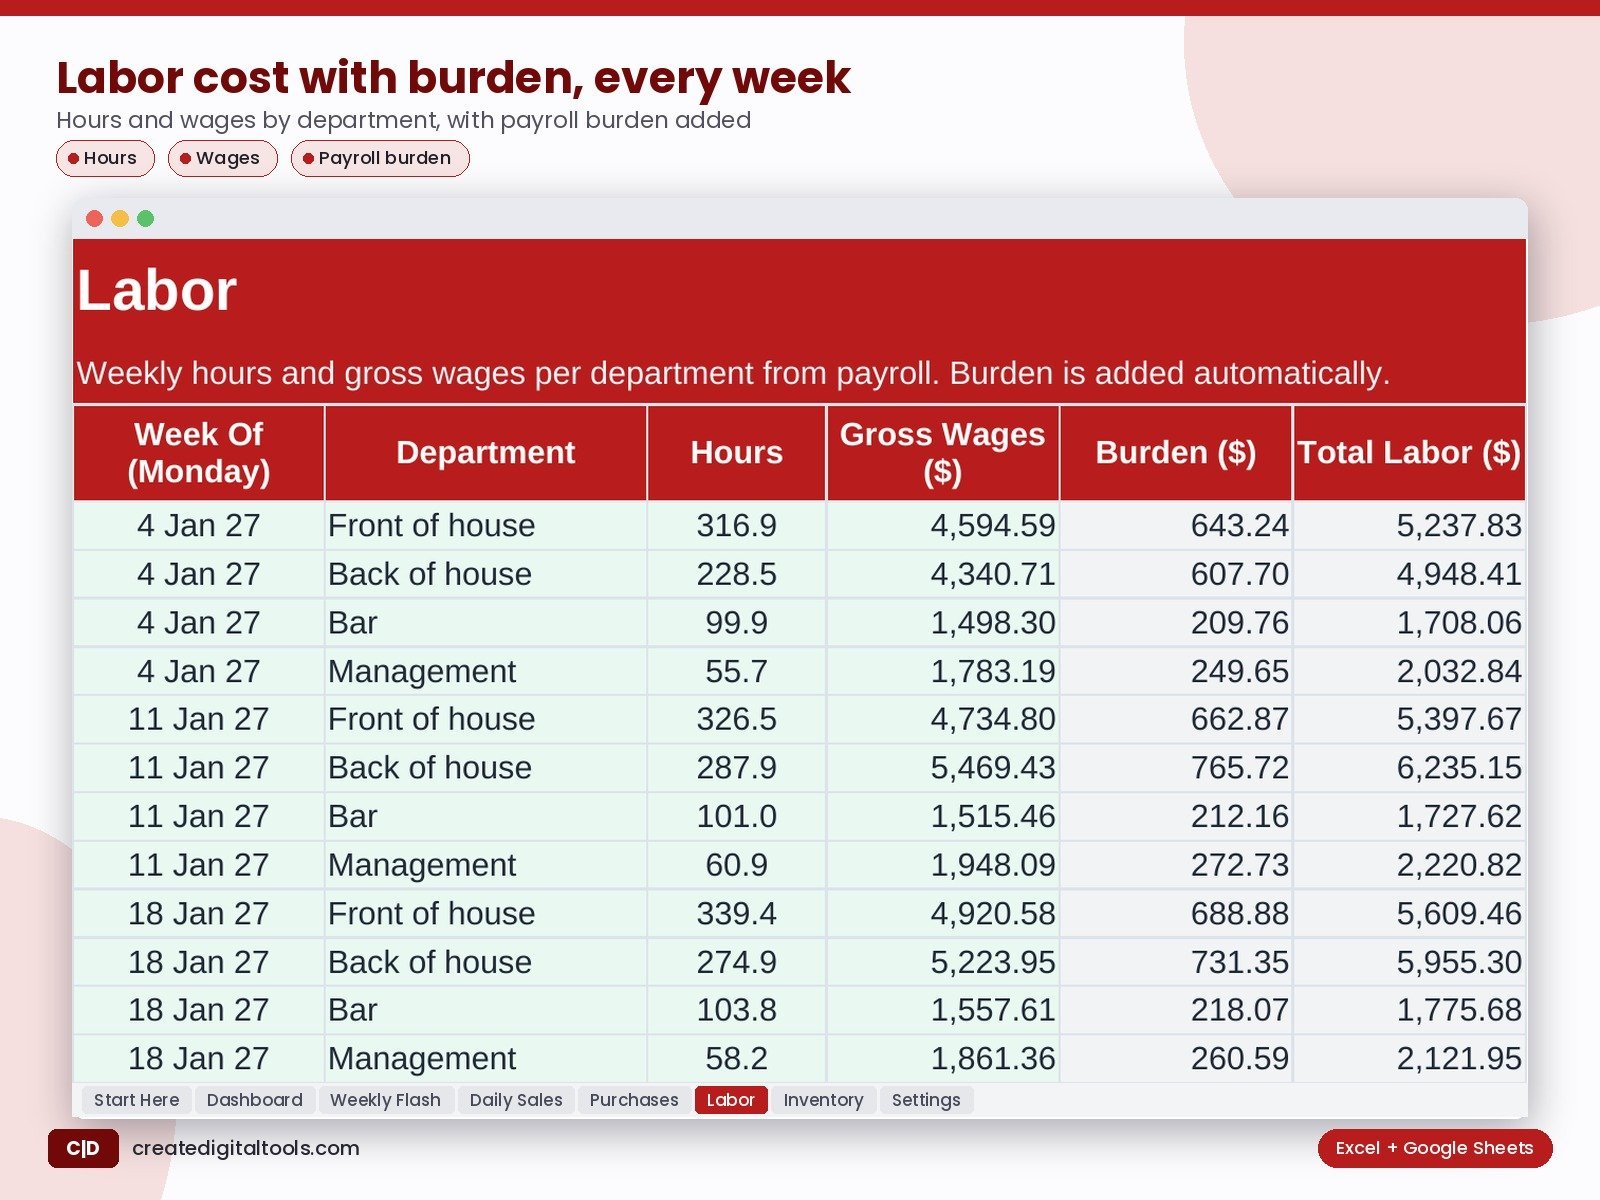
- Labor: Weekly hours and wages by department, with payroll burden added
- Inventory: End-of-week food and beverage inventory value
- Settings: Dates, burden %, targets, weekly fixed costs, vendors, departments
What you get
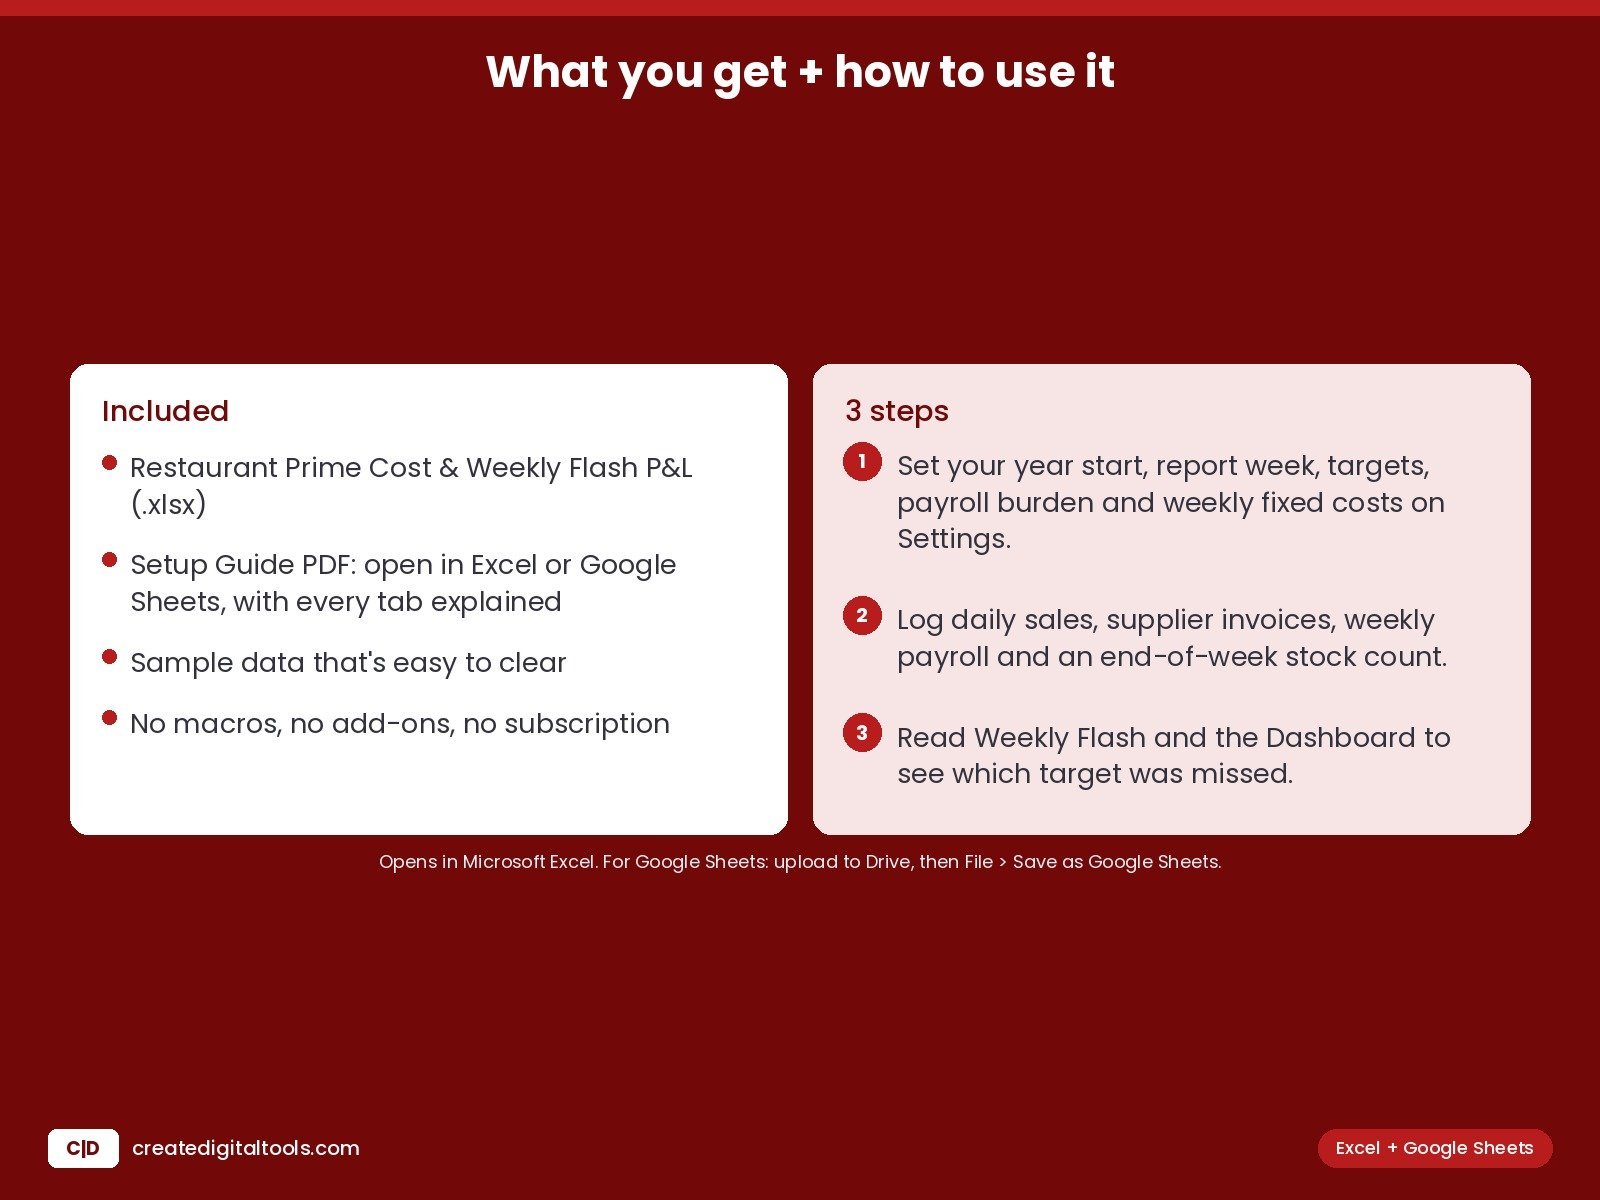
- The .xlsx workbook with sample data that’s easy to clear
- Setup Guide PDF, with every tab explained
- A video walkthrough
FAQ
Does it work in Google Sheets?
Yes. Upload it to Google Drive, open it with Google Sheets, then choose File > Save as Google Sheets.
Which Excel version do I need?
Excel 2019 or newer, Microsoft 365 or Excel for Mac.
Is this a subscription?
No. You pay once and keep the file. No macros, no add-ons.
The operating profit is a weekly estimate from your own fixed-cost figure, not a full accounting P&L. Targets and sample numbers are examples.
This is a digital product. No physical item will be shipped.
Also on Gumroad: Restaurant Prime Cost & Weekly Flash P&L on Gumroad
Build your own store: Hostinger WordPress hosting (affiliate link: I may earn a commission at no extra cost to you)