Description
Full Walkthrough
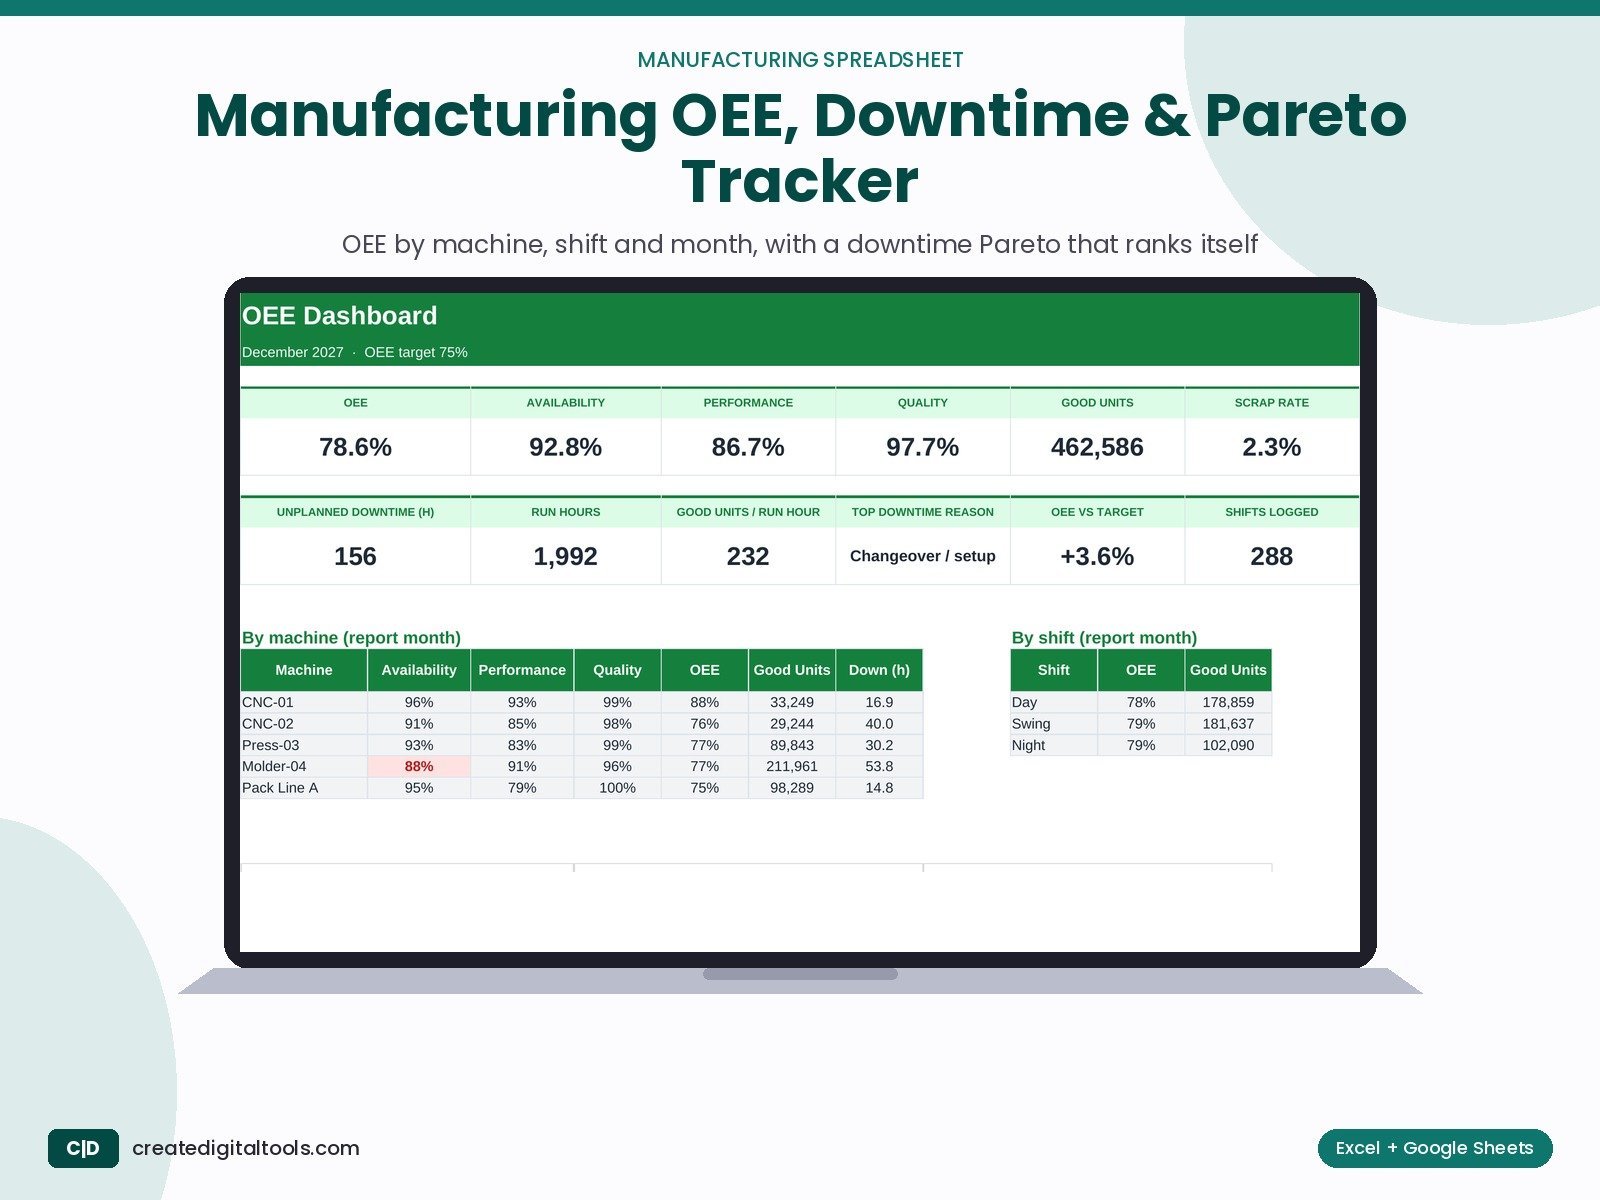
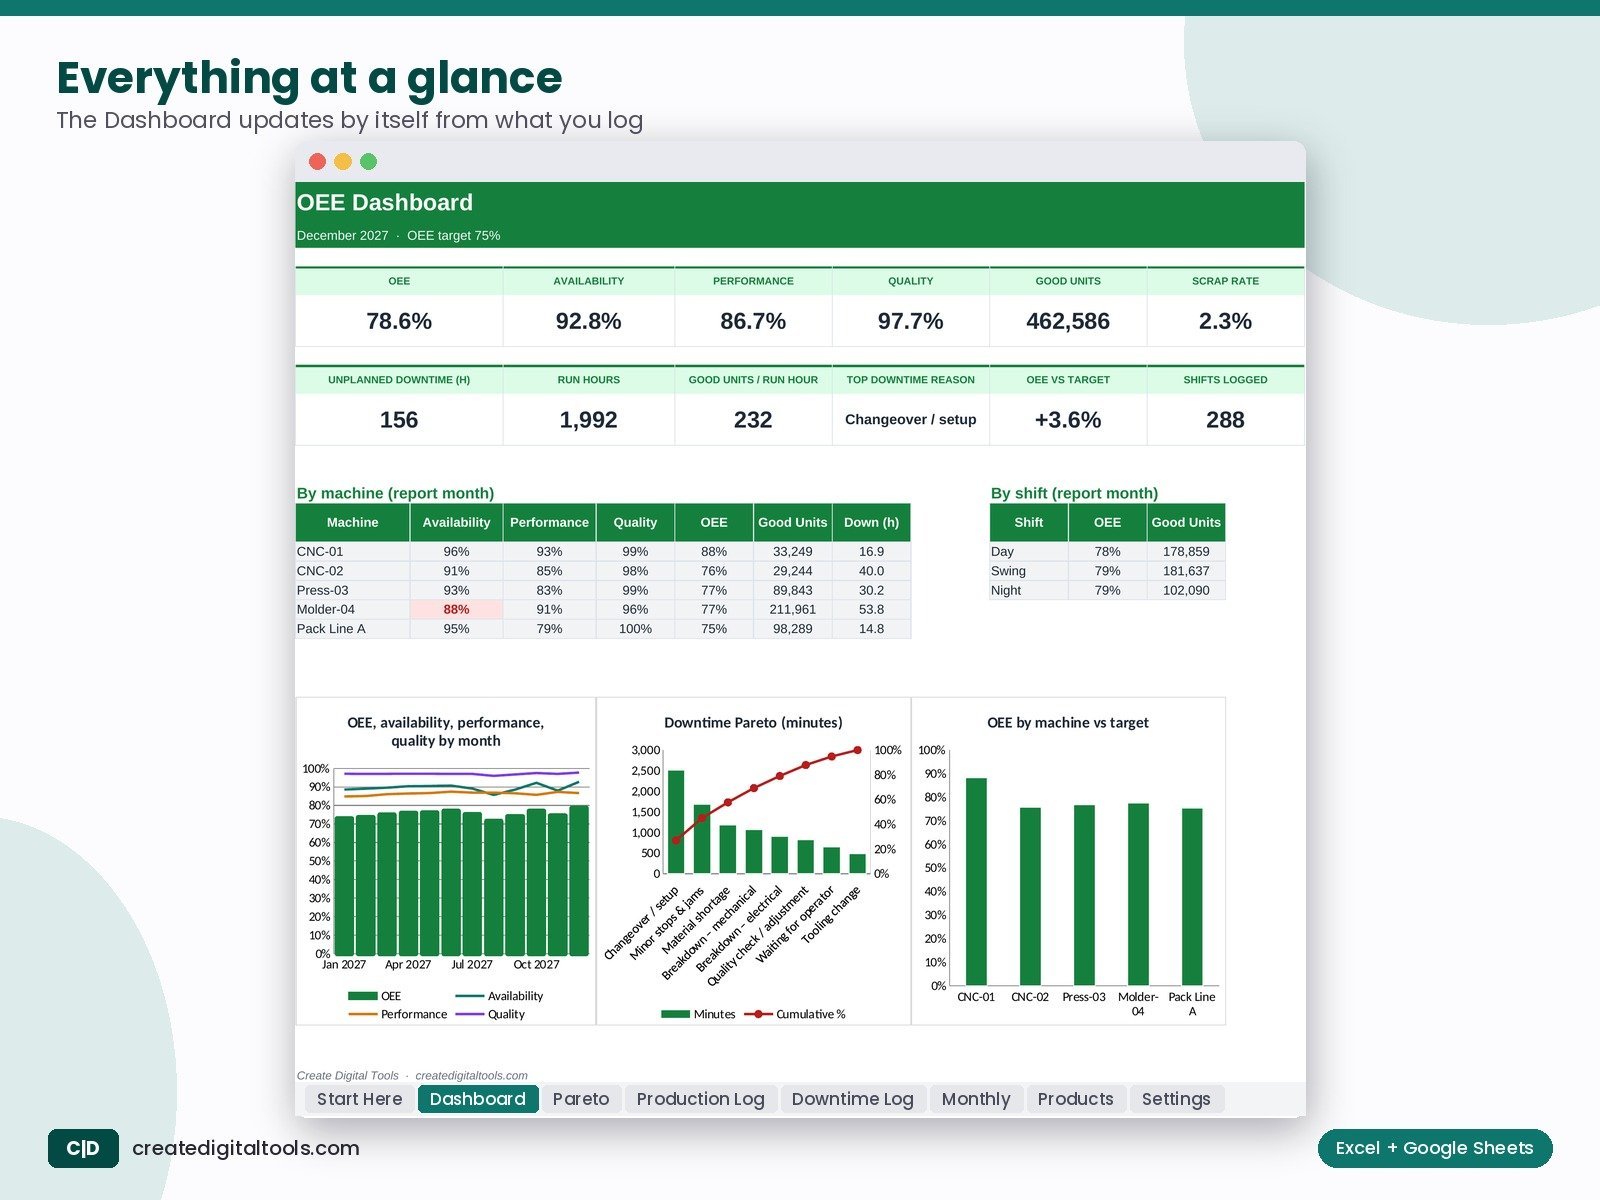
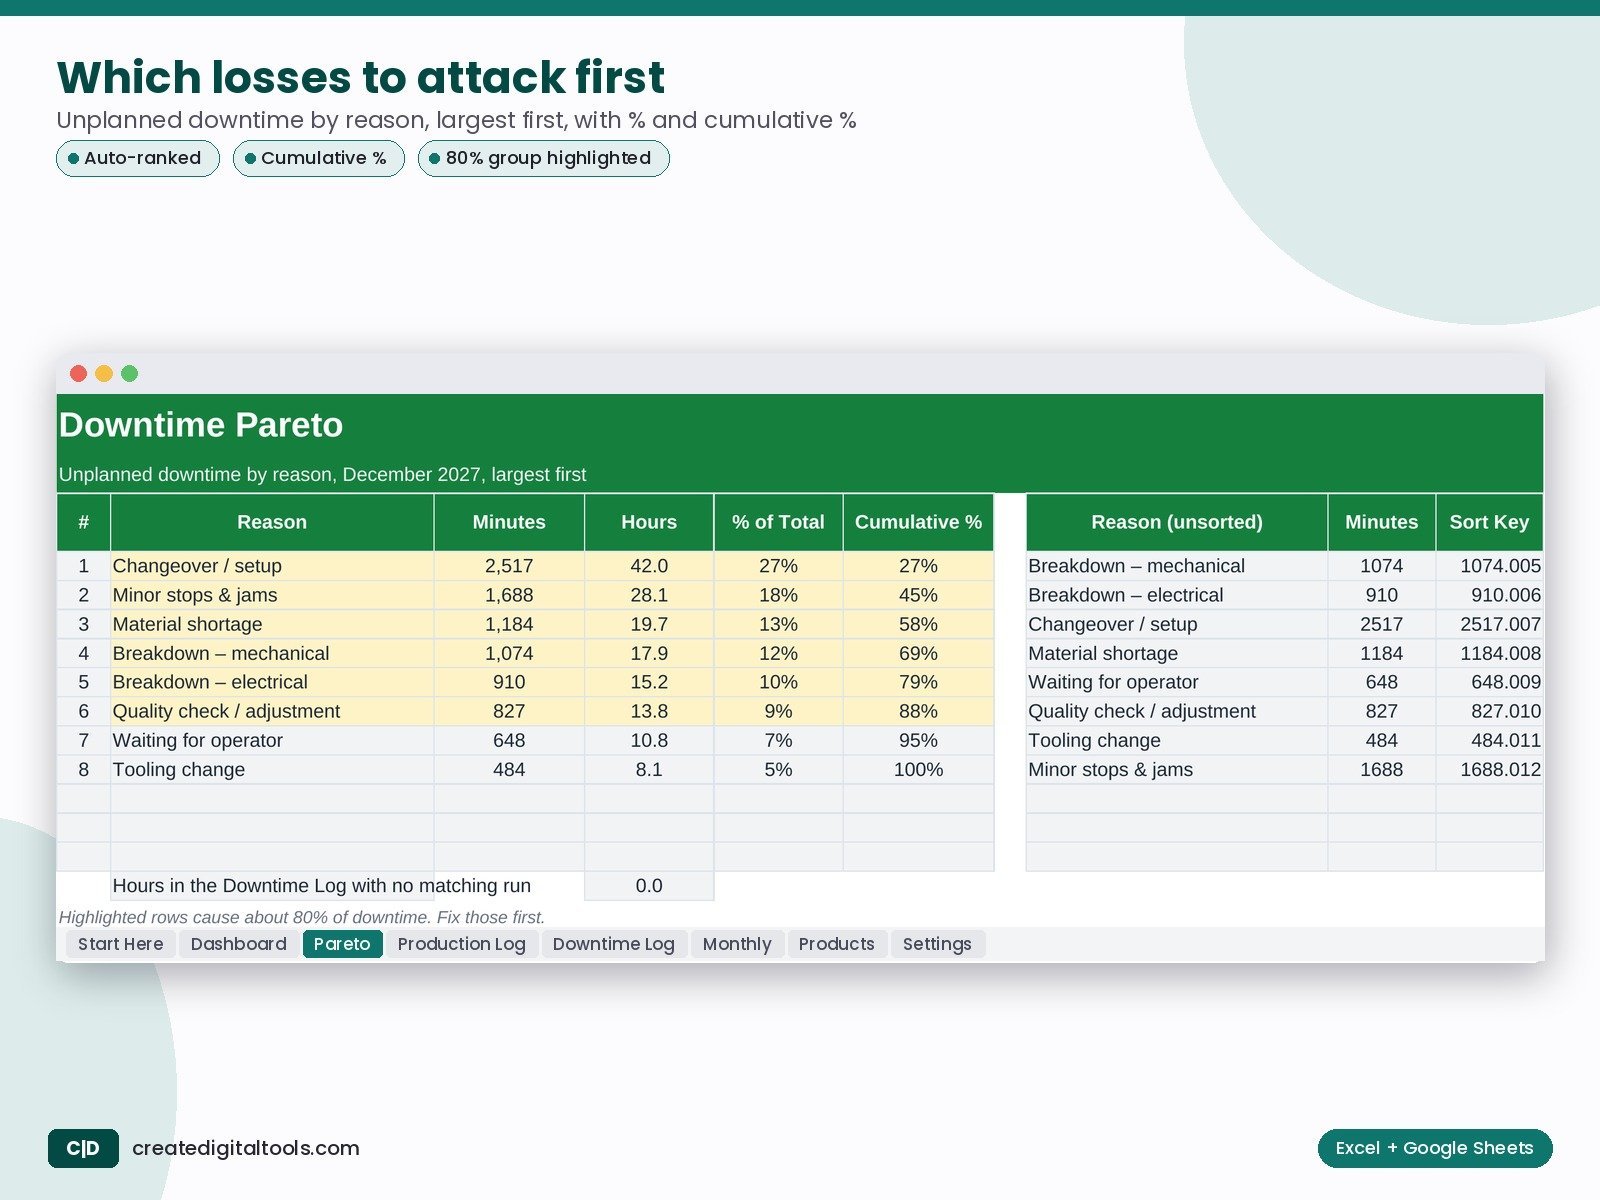
Log runs and stops. See availability, performance, quality and OEE by machine, shift and month, plus scrap and a ranked downtime Pareto with a cumulative line.
Who it’s for
Plant managers, production supervisors and lean or CI teams in small and mid-size manufacturing who log production by shift.
What’s inside
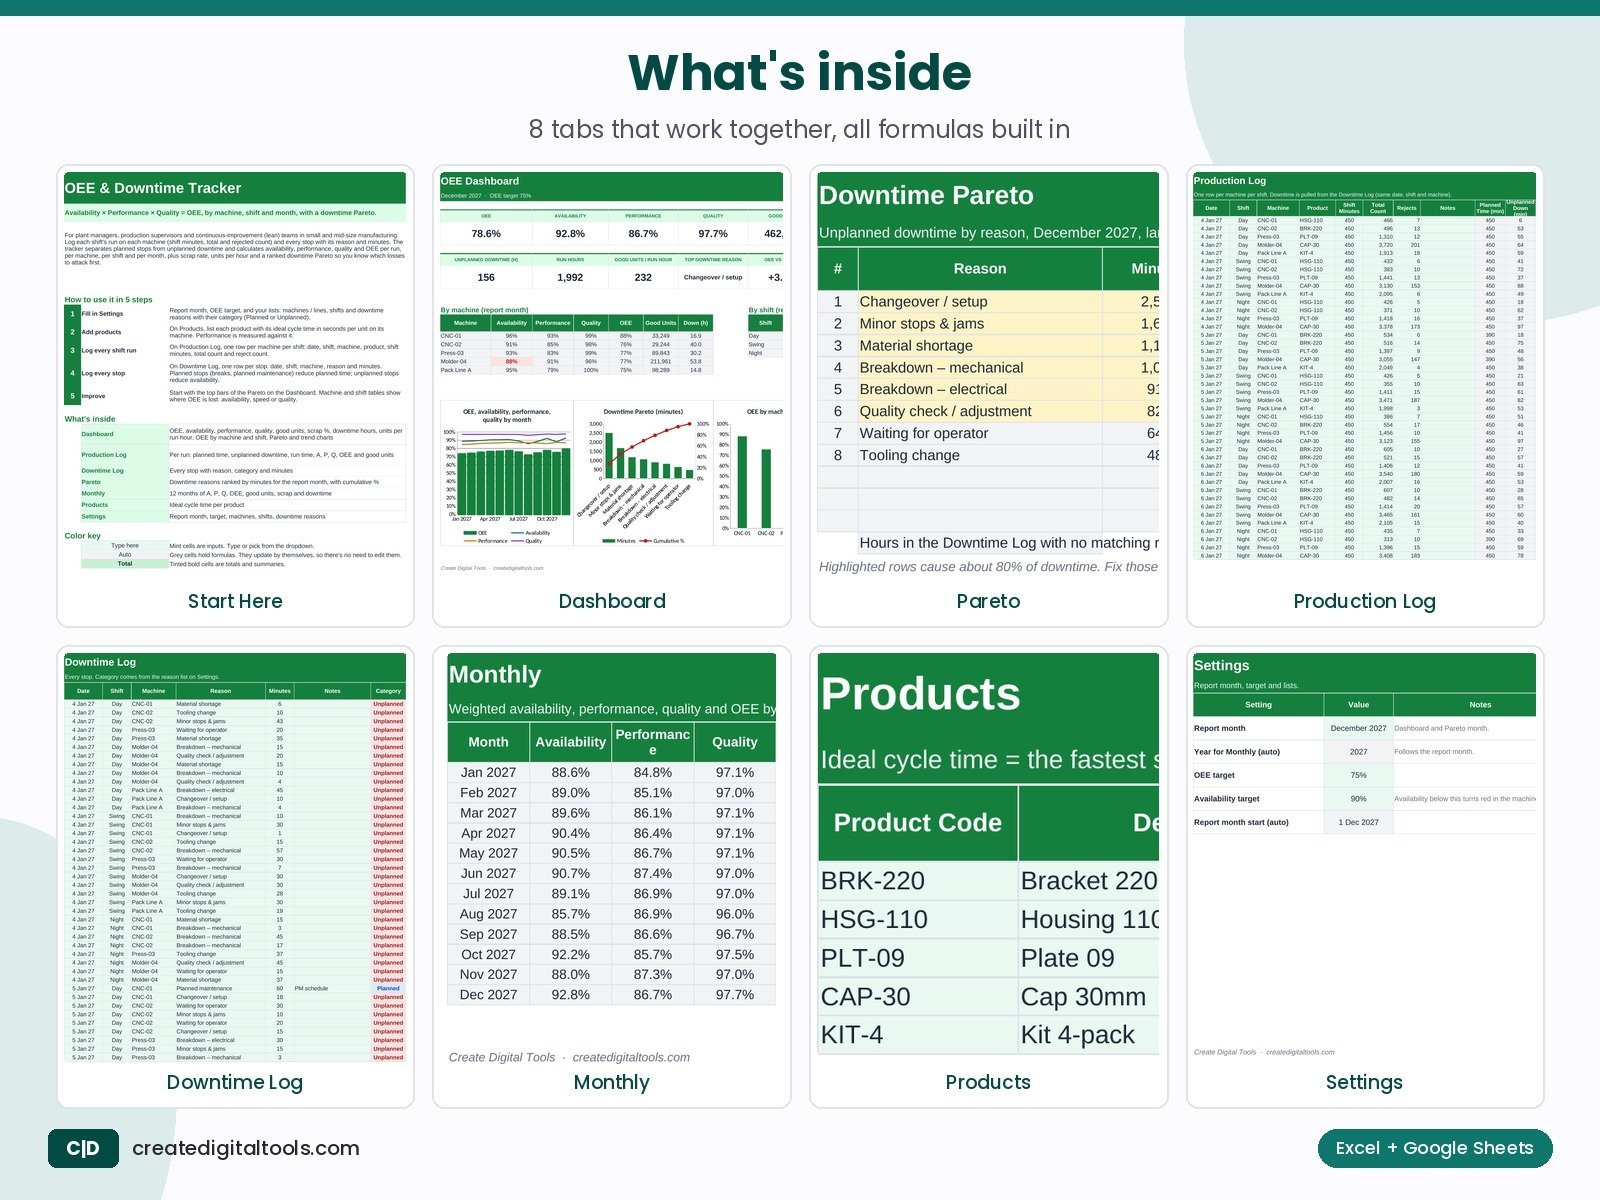
- Dashboard: OEE, availability, performance, quality, good units, scrap %, downtime hours, units per run hour, OEE by machine and shift, Pareto and trend charts
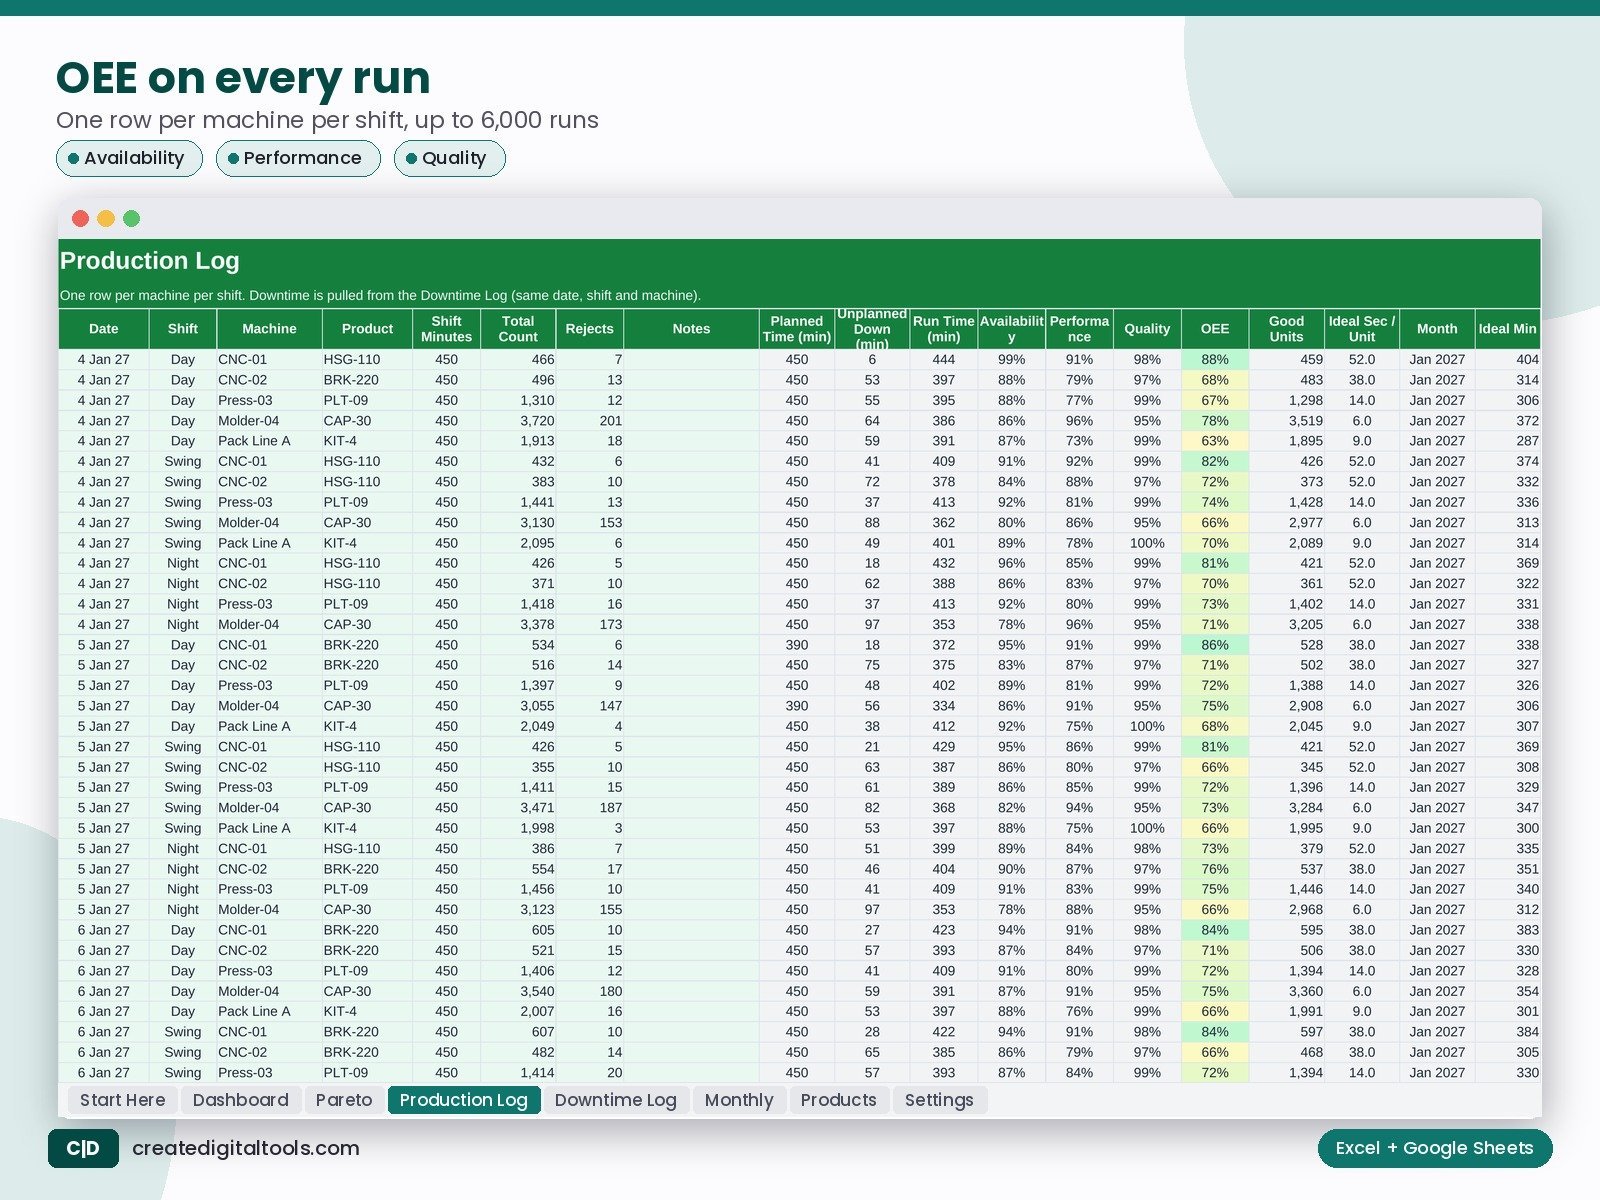
- Production Log: Per run: planned time, unplanned downtime, run time, A, P, Q, OEE and good units
- Downtime Log: Every stop with reason, category and minutes
- Pareto: Downtime reasons ranked by minutes for the report month, with cumulative %
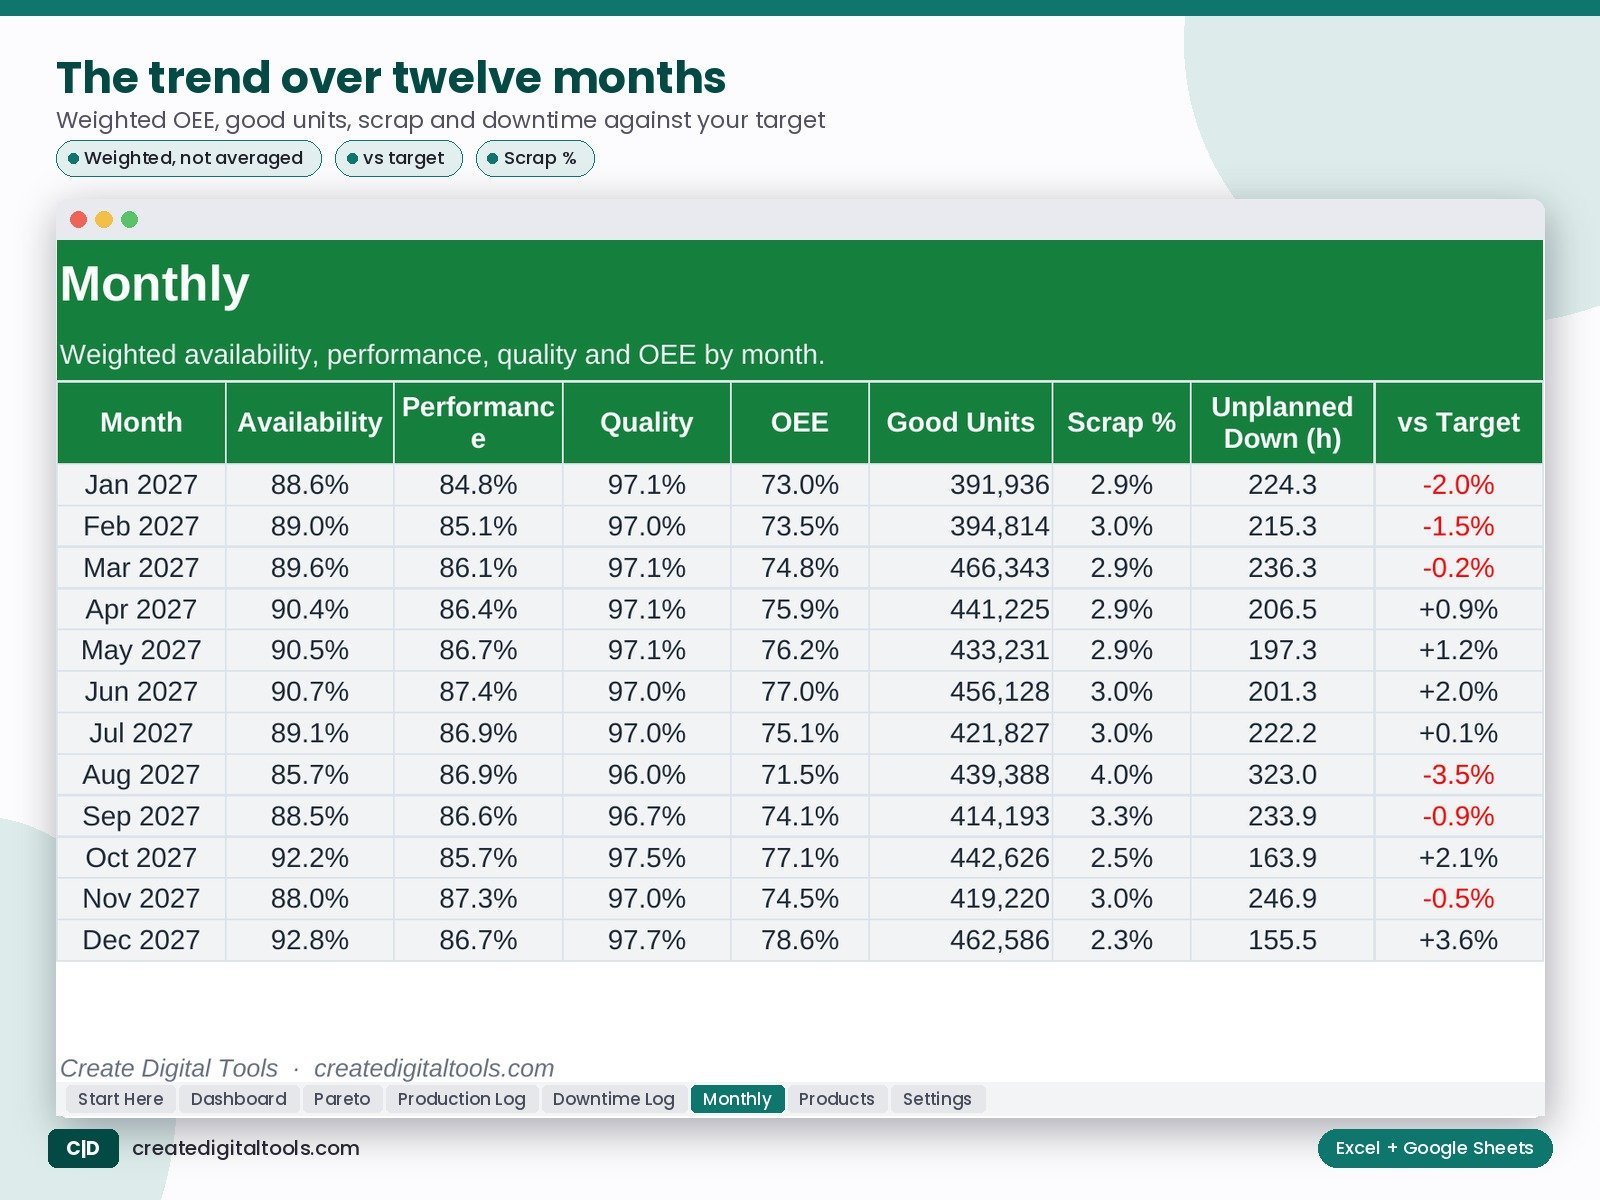
- Monthly: 12 months of A, P, Q, OEE, good units, scrap and downtime
- Products: Ideal cycle time per product
- Settings: Report month, target, machines, shifts, downtime reasons
What you get
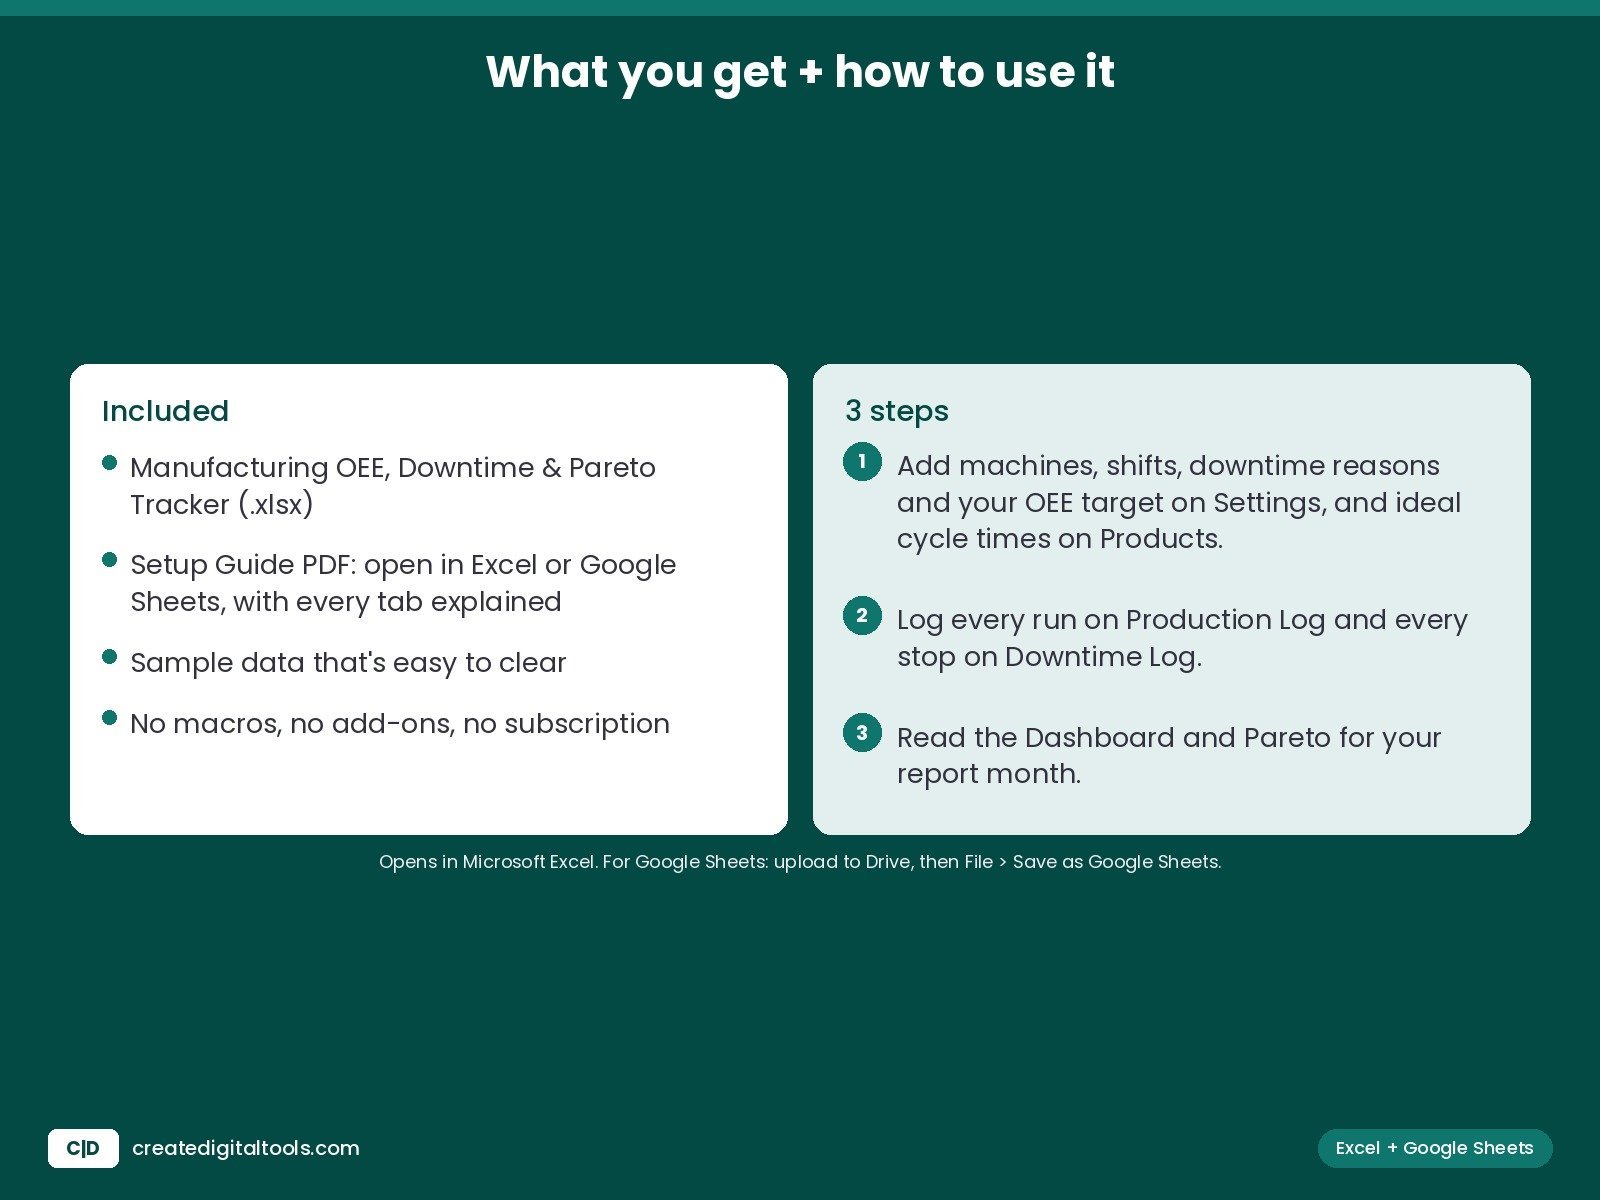
- The .xlsx workbook with sample data that’s easy to clear
- Setup Guide PDF, with every tab explained
- A video walkthrough
FAQ
Does it work in Google Sheets?
Yes. Upload it to Google Drive, open it with Google Sheets, then choose File > Save as Google Sheets.
Which Excel version do I need?
Excel 2019 or newer, Microsoft 365 or Excel for Mac.
Is this a subscription?
No. You pay once and keep the file. No macros, no add-ons.
Sample numbers are example data, not benchmarks.
This is a digital product. No physical item will be shipped.
Also on Gumroad: Manufacturing OEE, Downtime & Pareto Tracker on Gumroad
Build your own store: Hostinger WordPress hosting (affiliate link: I may earn a commission at no extra cost to you)