
Description
Full Walkthrough
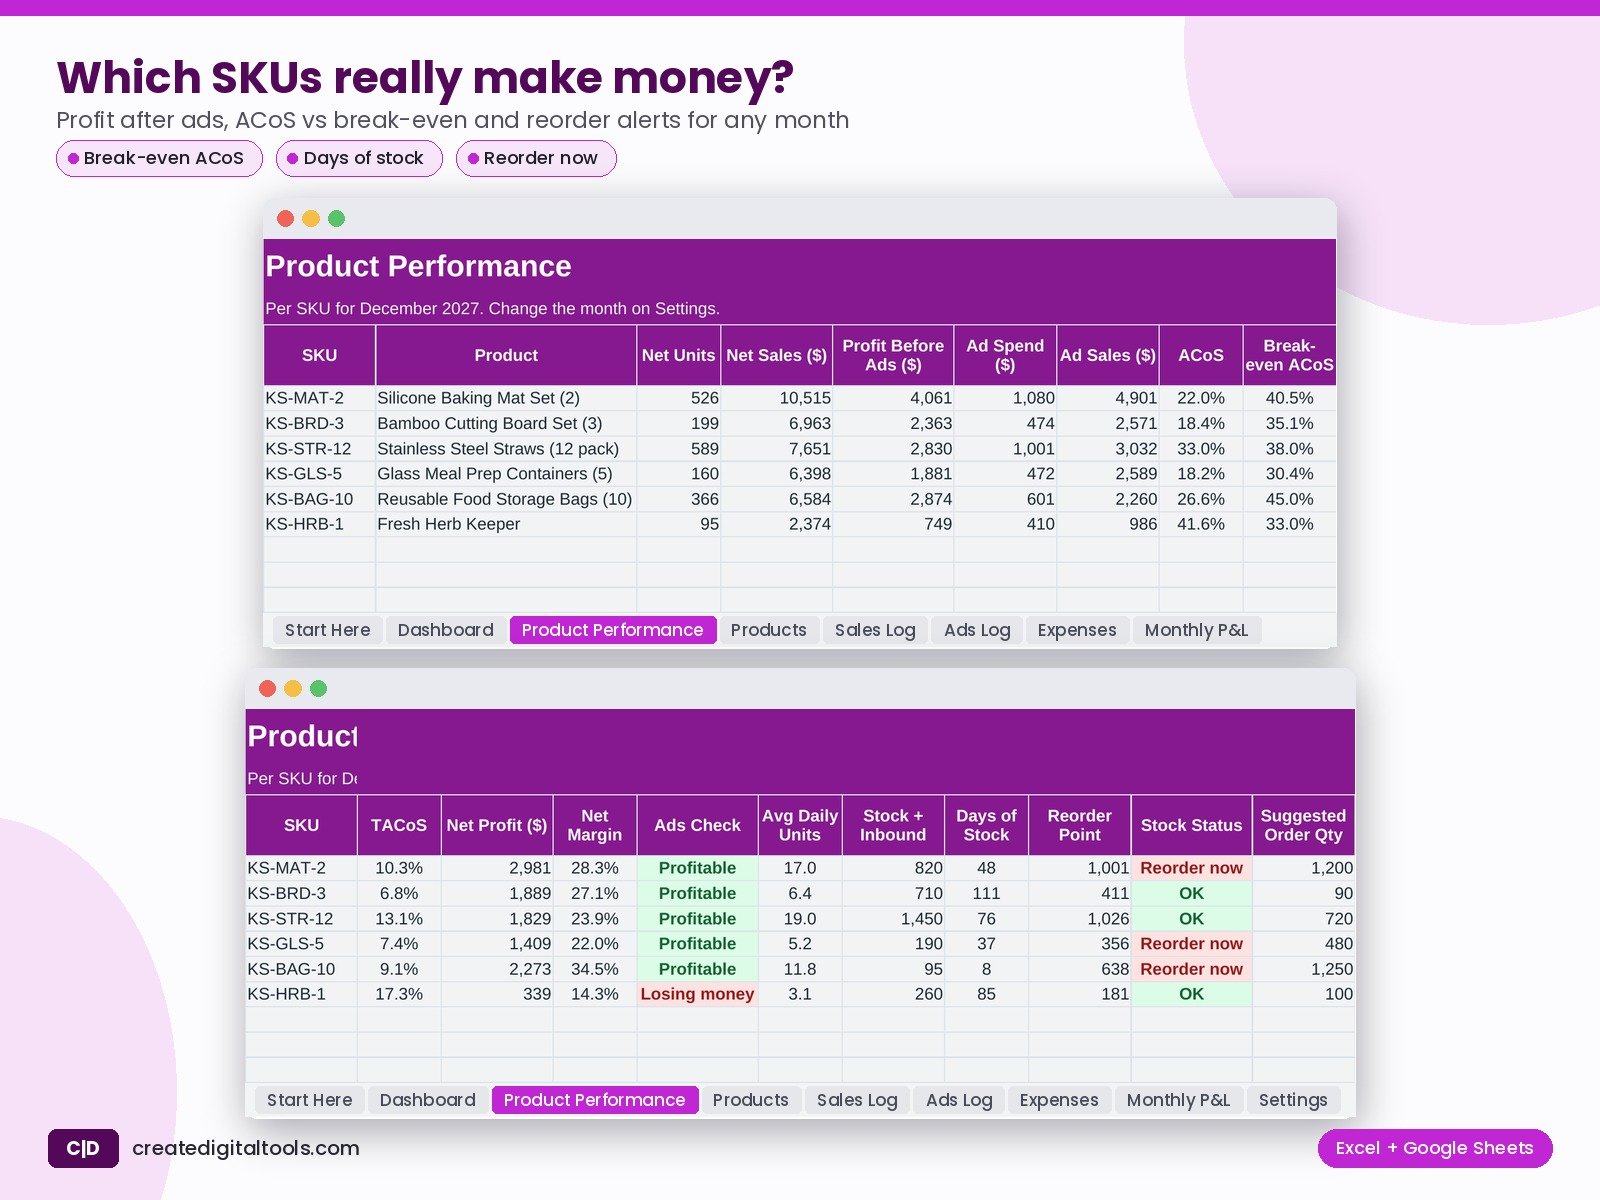
See profit per product after fees and ads, break-even ad cost, days of stock, reorder points and a 12-month P&L for online stores.
Who it’s for
Online store owners and direct-to-consumer brands who want true profit per product and clear reorder signals.
What’s inside
- Dashboard: Net sales, net profit, margin, ad spend, ACoS, TACoS, units, refund rate, profit per unit, SKUs to reorder, inventory value, charts
- Product Performance: Per SKU for the month: units, net sales, profit before / after ads, ACoS vs break-even, TACoS, days of stock, reorder point, order quantity
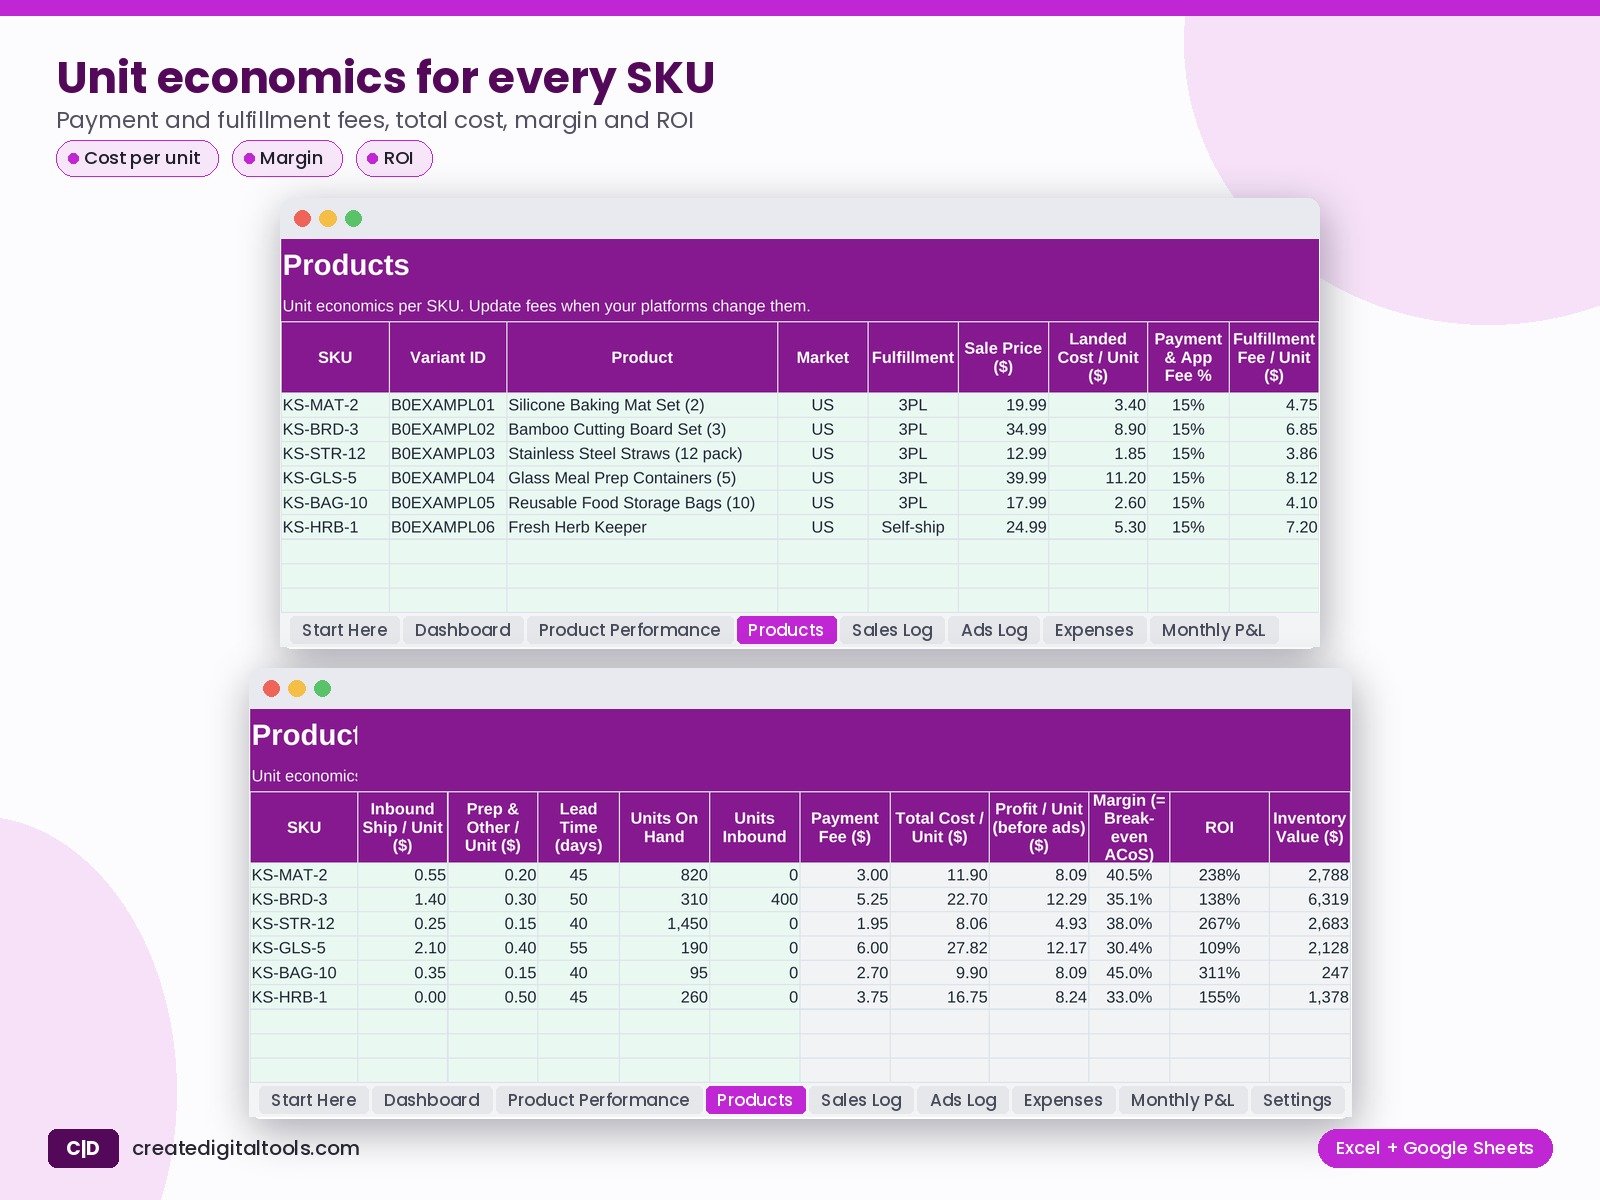
- Products: Unit economics per SKU: fees, total cost per unit, profit per unit, margin, break-even ACoS, ROI, inventory value
- Sales Log: Monthly units, sales and refunds per SKU, with COGS, fees and gross profit
- Ads Log: Ad spend, ad sales, ACoS, CTR, CPC, conversion rate and ROAS
- Expenses: Overheads not tied to a unit: software, samples, photography, storage, subscriptions
- Monthly P&L: 12 months: sales, refunds, COGS, fees, ads, expenses, net profit, margin, TACoS
- Settings: Currency, report month, targets, stock settings, lists
What you get
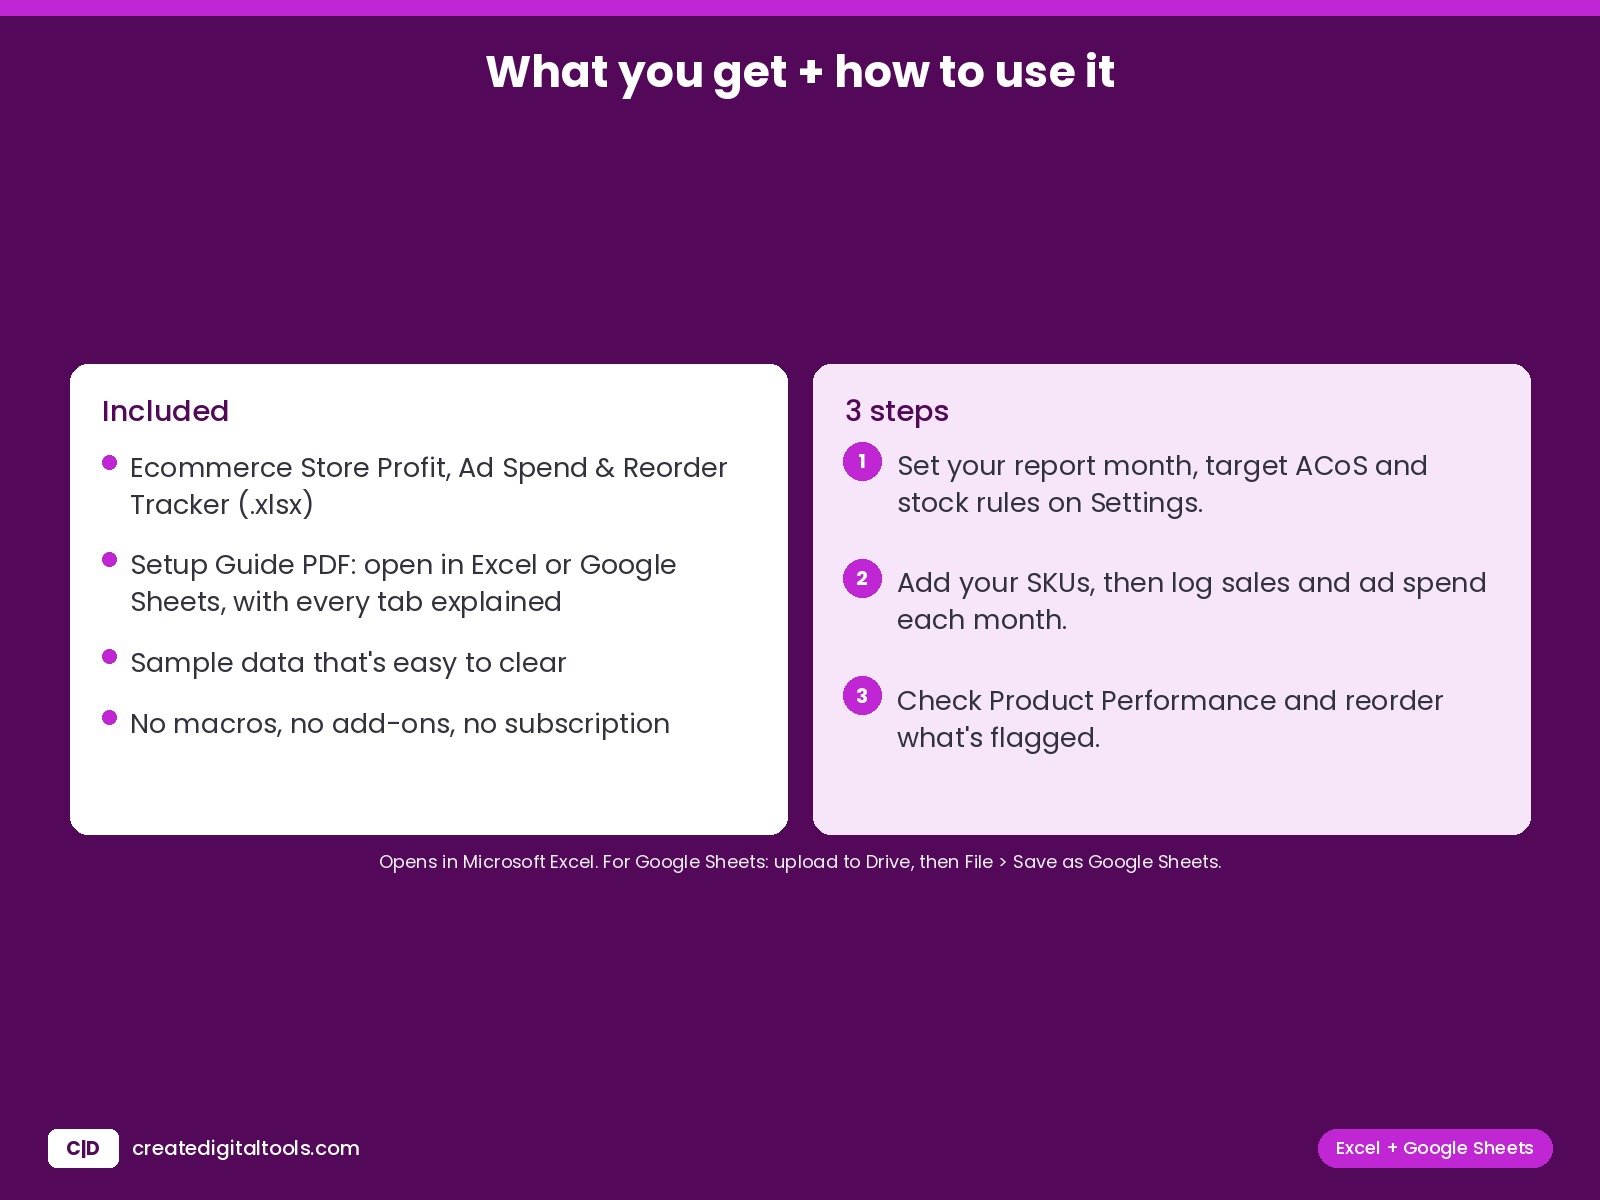
- The .xlsx workbook with sample data that’s easy to clear
- Setup Guide PDF, with every tab explained
- A video walkthrough
FAQ
Does it work in Google Sheets?
Yes. Upload it to Google Drive, open it with Google Sheets, then choose File > Save as Google Sheets.
Which Excel version do I need?
Excel 2019 or newer, Microsoft 365 or Excel for Mac.
Is this a subscription?
No. You pay once and keep the file. No macros, no add-ons.
This is a digital product. No physical item will be shipped.
Also on Gumroad: Ecommerce Store Profit, Ad Spend & Reorder Tracker on Gumroad
Build your own store: Hostinger WordPress hosting (affiliate link: I may earn a commission at no extra cost to you)