

Profit and Loss Statement (Excel + Google Sheets)
Profit and loss spreadsheet for Excel and Google Sheets: monthly P&L, annual statement, quarterly view, budget vs actual and a dashboard, all from one transactions list.
$3.99
Product Details
Log each sale and each cost once, and get a monthly P&L, an annual statement, a quarterly view, budget vs actual and a dashboard. Works in Microsoft Excel and Google Sheets.
Watch the setup guide & full tour
What’s inside (9 connected tabs)
- Start Here: 6 setup steps, colour key, tab guide
- Dashboard: revenue, gross profit and margin, operating costs, net profit and margin, best month, tax set-aside, this vs last month, budget watch, 2 charts
- Setup: business name, currency, year, tax set-aside %, 30 categories in 3 groups
- Transactions: 2,000 rows, category dropdown, month and quarter filled in from the date
- Monthly P&L: 12 months by category, gross and net profit, both margins
- Annual Statement: classic P&L with % of revenue on every line and key ratios
- Quarterly: Q1 to Q4 side by side with net margin and a chart
- Budget vs Actual: yearly budget scaled to date, variance, on track / watch / over budget
- Expense Breakdown: costs ranked biggest first with a pie chart
Why it helps
- Monthly, quarterly and annual P&L from one list of transactions
- Gross and net margin worked out for you
- Budget vs actual with clear status
- Tax set-aside reminder on the dashboard
- Formulas only: no macros, no add-ons, no subscription
- Sample data so you can see how it works
Included
- Profit-and-Loss-Statement.xlsx
- Setup Guide PDF
- Setup + full tour video
An organising tool, not tax or accounting advice.
Related products
-

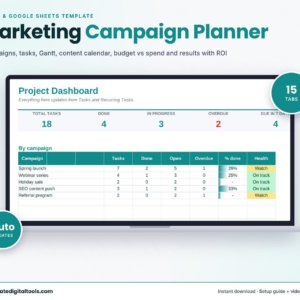
Marketing Campaign Planner Spreadsheet (Excel & Google Sheets)
$3.99 -
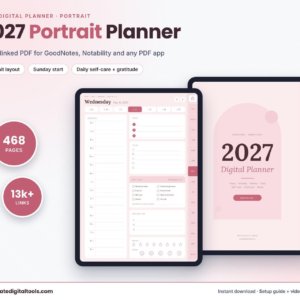
2027 Portrait Digital Planner, Blush (GoodNotes & Notability)
$3.49 -
Sale!
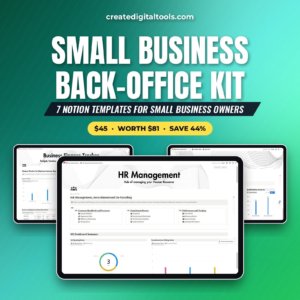
Small Business Back-Office Kit: 7 Notion Templates for Small Business Owners
Original price was: $81.00.$45.00Current price is: $45.00. -
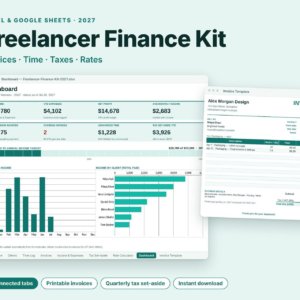
Freelancer Finance Kit: Invoice, Time, Tax & Rate Spreadsheet (Excel + Google Sheets)
$3.99